Article Text

Abstract
Objectives: (1) To develop and implement a standard medication chart, for recording prescribing (medication orders) and administration of medication in public hospitals in Queensland. (2) To assess the chart’s impact on the frequency and type of prescribing errors, adverse drug reaction (ADR) documentation and safety of warfarin prescribing. (3) To use the chart to facilitate safe medication management training.
Design, setting and participants: The medication chart was developed through a process of incident analysis and work practice mapping by a multidisciplinary collaborative. Observational audits by nurse and pharmacist pairs, of all available prescriptions before and after introduction of the standard medication chart, were undertaken in five sites.
Results: Similar numbers of both patients (730 pre-implementation and 751 post-implementation; orders, 9772 before and 10 352 after) were observed. The prescribing error rate decreased from 20.0% of orders per patient before to 15.8% after (Mann–Whitney U test, p = 0.03). Previous ADRs were not documented for 19.5% of 185 patients before and 11.2% of 197 patients after (χ2, p = 0.032). Prescribing errors involving selection of a drug to which a patient had had a previous ADR decreased from 11.3% of patients before to 4.6% after (χ2, p = 0.021). International normalised ratios (INRs) >5 decreased from 1.9% of 14 405 INRs in the 12 months before to 1.45% of 15 090 INRs after (χ2, p = 0.004). After minor modifications, the chart was introduced into all hospitals statewide, which enabled standardised medication training and safer rotation of staff. The chart also formed the basis for the National Inpatient Medication Chart.
Conclusion: Introduction of a standard revised medication chart significantly reduced the frequency of prescribing errors, improved ADR documentation and decreased the potential risks associated with warfarin management. The standard chart has enabled uniform training in medicine management.
Statistics from Altmetric.com
Safe and effective prescribing requires identification of the need for a drug and selection of the correct drug, together with the route, form, dose, frequency and duration, for the individual patient.1 The documentation of prescribing information, either handwritten or electronic, provides instructions for medication supply and administration. Furthermore, the medication chart enables communication of prescribing information between doctors, pharmacists and nurses and acts as a record of medication administration. Prescribing, supply and administration is a cyclical process, and the chart is a critical component of the medication management pathway2 (fig 1). While undertaken in Australia, this study has international relevance as the principles discussed here have implications for the development and evaluation of all medication systems.

Medication management pathway. Reproduced with permission from J Pharm Pract Res 2004;34:294.
Medication errors are common, and prescribing errors are potentially the most serious of all.3 4 The definition of a prescribing error utilised in this study was as follows: “A prescribing decision or prescription writing process that results in an unintentional, significant reduction in the probability of treatment being timely and effective or increases the risk of harm, when compared with generally accepted practice”.5
Unless detected early and corrected, prescribing errors can result in supply, administration and re-prescribing errors.2 A small but significant proportion of errors result in adverse drug events (ADEs). ADEs encompass both harm that results from the intrinsic nature of the medicine (an adverse drug reaction (ADR)) as well as harm that results from medication errors or system failures associated with the manufacture or distribution or use of medicines.6 Approximately 50% of errors are deemed preventable.3 7 8 9 10 11 The frequency of prescribing errors per order varies between 0.3% and 39.1%,12 depending on the definition and method employed in their detection.
A culture exists where drug selection is seen as the critical component of prescribing, and the dose, route and frequency are considered less important.13 14 The writing of the prescription is seen as a low risk chore, undertaken frequently by junior doctors, and orders are often incomplete, ambiguous or illegible. Misinterpretation of instructions results in further medication errors and potentially in ADEs.3 13 15 16 17
The causes of prescribing errors and ADEs are multifactorial.17 Individual factors include lack of drug and patient knowledge and of prescribing skills.13 15 18 Team factors include lack of supervision of juniors’ prescribing.19 Most prescribing in Australian hospitals is handwritten, in a non-standardised, cumbersome and error-prone paper system.
To reduce errors, multiple interventions are required at different levels the individual, team, system, environment and culture.4 14 20 Individual interventions include increasing prescribers’ drug knowledge, prescribing skills and ability to tailor the prescription to the individual.1 Appropriate, tailored supervision of junior doctors is required to ensure senior doctors’ prescribing decisions are correctly converted into unambiguous and accurate medication orders.14 17
Electronic prescribing with clinical decision support (CDS) offers a partial solution,21 22 but an effective system is not currently available in Australia.23 24 Conversely, a minority of hospitals in the United States while using electronic prescribing include an added error prone step of transcription from a written order into an electronic order entry system.3
Many different medication charts have existed within and across hospitals and standardisation of systems has been recommended in the UK14 25 26 and Australia.27 Standardisation, as identified in many other high-risk industries, reduces errors caused by unfamiliarity and facilitates more efficient and effective training for staff moving between sites.14 28 29
The dangerous interaction of humans with poorly designed systems is a common cause of human error.30 The content and layout of charts have contributed to prescribing errors.17 Revision of the chart layout could further reduce errors. The benefits in terms of the effect on frequency and type of prescribing errors have not previously been reported.31
The aim of this study was to develop a standardised medication chart for public hospitals in Queensland and evaluate its impact on prescribing errors, documentation of previous ADR or allergies and safety of warfarin prescribing. In addition, the standard chart was expected to enable standardised training on its use.
Materials and methods
Medication chart redesign
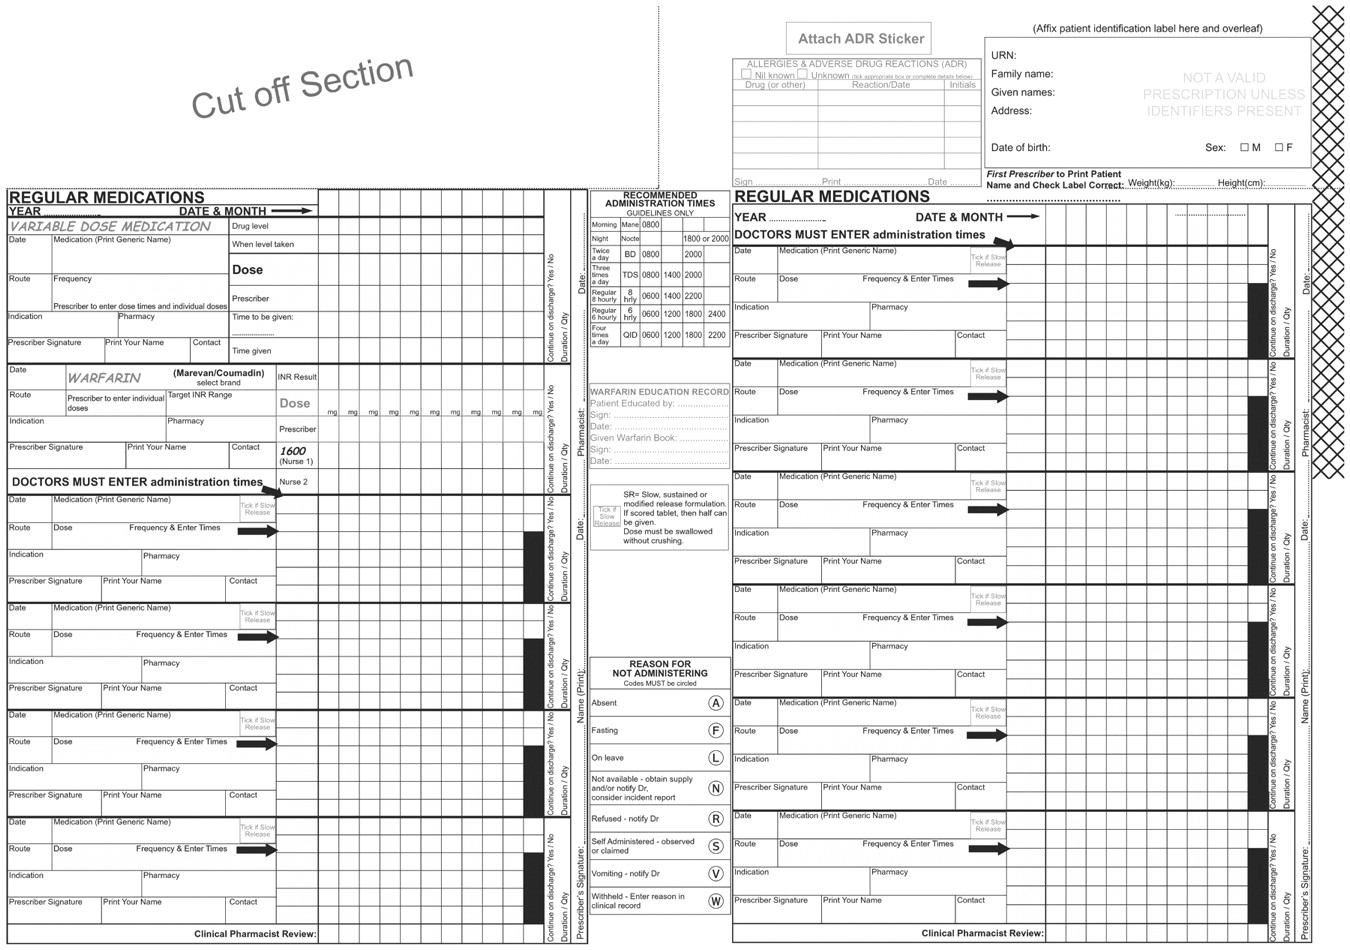
A collaborative of doctors, nurses and pharmacists from seven hospitals in south Brisbane was established to address statewide and local medication safety issues in 2002. A standardised medication chart including revised ADR documentation alerts and warfarin management was agreed as an initial priority. The standard medication chart was designed incorporating recommendations from the literature, human factors analysis of local incidents, previous studies of medication ordering and administration32 33 34 and structured interviews with interns involved with prescribing errors.17
For example, the previous chart required doctors to prescribe a drug on the inside of a chart, when the information indicating a serious previous ADR to the same drug was in a “blind spot” on the front. The revised chart was redesigned so that the patient identifier and ADR details were visible on three pages where all once only and regular medications were prescribed and administered.
Prescribers were prompted to enter dosing times for regular medication to prevent nursing staff misinterpreting a dosing frequency instruction such as od (once a day) as bd (twice a day).16
A designated warfarin section prompted for the indication, target international normalised ratio (INR) range and current INR at the point of prescribing and administration to enable informed decision making. In addition, prescribing guidelines were placed in every end-of-bed folder where medication charts are located as a form of CDS. The warfarin dose administration time was changed from 18:00 to 16:00. This change had been demonstrated to result in the patient’s own medical team being contacted for a dose rather than on call staff, unfamiliar with the patient.35
Work practice mapping and piloting of revised chart layouts with medical, nursing and pharmacy staff followed the initial development.36 Implementation and training sessions for medical, nursing and pharmacy staff were held at all sites to explain the rationale for safety features and layout changes. The 2007 version of the chart is shown in Appendix 1.
Prescribing error study design
The null hypothesis being tested was that a standardised revised prescribing system would not have any effect on the frequency of prescribing errors. A prospective, before-and-after observational audit was undertaken by pairs of a research pharmacist or nurse teamed with a local nurse or pharmacist. Each observer was trained using six standard scenarios to ensure validity. Inter-rater reliability was not determined; however, both observers had to agree on errors. Where any disagreement occurred, a third researcher was involved. The same researchers undertook the pre and post audits.
Direct observation methodology was used.37 38 Data were collected from regular medication charts, on the same medical, surgical, paediatric and mental health wards in the before and after. Intensive care units at the two teaching hospitals used electronic prescribing systems and were excluded. In addition, continuous infusions, insulin, chemotherapy, acute and chronic parenteral analgesia and discharge charts were excluded from this study.
The observers identified and documented prescribing errors using established definitions in all available medication orders for each patient, including those cancelled or previously changed.5 Definitions and examples of errors are shown in table 1. A standard drug information text39 was used to define dosing and frequency errors. The appropriateness of prescribing was not examined in this study. Although there could only be one specific error associated with the name, form, route, dose or frequency in each order, each order could have included more than one type of error.
Prescribing errors and ADR documentation errors with examples
The criterion for route errors in the pre-intervention study was an omission or illegible order. In the subsequent audit, this criterion included potentially confusing abbreviations (s/l (sublingual) and s/c (subcutaneous)) and, therefore, error rates could not be compared. Unclear PRN frequency errors were not collected at one site.
Observers considered the worst possible outcome assuming the order might be seen by an inexperienced, nurse or pharmacist and considered whether an administration or supply error could result from misinterpretation of a specific order. In cases of discordance, a third researcher was asked to interpret the order. Data collection was undertaken at least half-way through the junior doctors’ rotation to reduce any effect of unfamiliarity with their clinical unit. Wards received a variable level of clinical pharmacy service from daily on Monday to Friday, to once weekly.
Five of the seven collaborative sites collected outcome measures 4 months before the intervention in 2002 and 6 months after, in 2003, and included numbers of patients and orders, prescribing errors, ADR documentation and warfarin prescribing. Inpatient INR results, excluding those from patients in emergency departments, outpatients and preadmission clinics, were collected for the 12 months before and after the intervention. These INRs included a consistent background of patients not receiving warfarin therapy. The proportion of INRs >5 was recorded and used as an indicator of increased risk of bleeding.40 Ethics approval was obtained in accordance with requirements.
Analytical methods
The primary outcome measures were the frequency of prescribing error per patient and rate of errors per order per patient, ADR documentation and warfarin management before and after introduction of the standard medication chart. Errors are expressed as actual numbers and percentages. Absolute and relative risk reductions were calculated. Nominal data were compared using the χ2 or Fisher’s exact test and odds ratios (with 95% CIs) are presented. Data not normally distributed, as identified by the K-S test, are compared using the Mann–Whitney U test. Tests of continuous data are calculated as two-tailed and p<0.05 predetermined to represent statistical significance. All statistical analyses were carried out with SPSS V.11.5.
Results
Prescribing error outcomes
Table 2 presents data on patients, medication orders and prescribing errors. Table 3 presents error rates per site and table 4 presents the types of error identified.
Patients, medication orders and prescribing errors identified
Sites and error rates pre- and post-intervention
Prescribing errors according to the stage of the drug use process
Similar numbers of patients, numbers of orders and number of orders per patient were observed before and after the intervention. Prescribing errors decreased after the intervention; from 2300 errors in 9772 medication orders in 730 patients to 1935 in 10 352 orders in 751 patients (table 2).
The number of patients with one or more errors did not change significantly from 591 (81.0%) before to 587 (78.1%) after. However, the prescribing errors per patient as illustrated in fig 2 were significantly less frequent after the intervention (Mann–Whitney test, p = 0.021). The percentage of errors per order per patient (errors per patient divided by the total numbers of orders times by 100) also decreased significantly from 20% (range 0–250%) before to 15.8% (0–180%) after the intervention, with an absolute error reduction of 4.2% (Mann–Whitney test, p = 0.03).

Errors per patient before and after standard medication chart.
The baseline error rates in sites 1–4 were similar (Kruskal–Wallis test for analysis of variance non significant) and their overall chart layout, four-sided, with separate stat, regular and PRN orders, was similar (table 3). Site 5 had a significantly higher baseline error rate and a markedly different medication chart, two-sided with merged regular and PRN orders (Kruskal–Wallis test, p<0.001). Post-intervention the total error rate was similar for sites 1–4; site 5 maintained a higher median and range (Kruskal–Wallis, p = 0.025), while the error rate per order per patient showed no significant variance between all five sites post intervention. Site 5 represented <15% of the sample.
Re-exposure of patients to drugs causing previous ADR was the only prescribing selection error that significantly decreased after the intervention from 21 (0.21%) to 9 (0.08%) (table 4).
All administration and supply instruction errors were reduced significantly except PRN frequency errors. The number of unclear PRN frequency errors decreased significantly from 577 (27.6%) of orders before to 485 (23.7%) after introduction of the standard chart (χ2, p = 0.004). However, the number of PRN orders missing a frequency increased significantly from 140 (6.7%) of PRN orders before to 214 (10.5%) after the intervention (χ2,p<0.001) (table 4).
After discussing these findings with the collaborative clinicians, we identified that by preprinting the letter “PRN” in large font on the redesigned chart, some prescribers left the decision on dosing frequency to the nurses’ discretion. Other prescribers stated that the large preprinted “PRN” reduced the space to write an hourly frequency and, therefore, they only entered a dose.
More than 70% of doctors appeared to complete regular dose administration times, resulting in a nonsignificant decrease in the number of incidents where the administration times did not correspond with the dosing frequency from 0.53% before to 0.40% after.
ADR documentation
The patients’ medication charts were used as the primary source of ADR history information. There was no significant difference in the total number of patients with previous ADRs or the total number of ADRs in the pre and post audits. In the “pre” cohort, 185 patients (25.4%) had a total of 302 ADRs. In the “post” cohort, 197 patients (26.7%) had a total of 311 ADRs.
The rate of prescribing of medication (or class) to which the patient had a previous ADR decreased by 59% from 21 of 185 (11.3%) of patients with a previous ADR in the pre-audit, to 9 of 197 (4.6%) after the intervention (ARR 6.7%; χ2, p = 0.021).
Warfarin prescribing and INR
There were similar numbers of patients prescribed warfarin before (48 (6.6%)) and after (53 (7.1%)) introduction of the new chart. In the audit of the new chart, the indication was documented in 47 (89%) of patients and the target INR range in 44 (83%) of patients.
INR data were only available from four of the five sites. The number of INR results >5 decreased by 23% from 271 of 14 405 INRs (1.9%) during the year pre-intervention to 219 of 15 090 INRs (1.45%) post-intervention (χ2, p = 0.004). This might be expected to result in fewer patients experiencing bleeding.
Discussion
This study describes the development, implementation and impact of a standard paper-based medication chart on medication safety in five hospitals. When comparing the results before and after the intervention, a similar proportion of patients with a similar number of orders had at least one error. However, the total number of errors decreased from 2300 to 1935, implying that there were fewer errors in those patients in which an error was identified.
There was a significant reduction in the number of errors per patient and the proportion of orders with an error per patient after the intervention and a reduction in the proportion of errors in administration and supply instructions associated with drug name, dose and regular frequency and the re-prescribing of a drug to which patients had had a previous ADR. Improvements in warfarin safety were also demonstrated.
The lessons learned from the processes of system redesign, evaluation and interpretation have relevance to both paper-based and electronic systems at each stage of prescribing, administration and supply of medications.
Possible explanations for reduction in error rate observed
The wards used in both audits were identical, and the number of patients, orders and orders per patient were similar. The use of the same researchers in both audits ensured a consistent approach. The involvement of researchers who had developed the chart was unlikely to have lead to any bias as strict protocols were adhered to and each researcher was paired with a local clinician. Although the junior medical staff would have changed between the two audits, most came from the same university, and there had been no known changes to prescribing education.
While site 5 (representing <15% of patients audited) had a markedly different chart design and a significantly higher baseline error rate before the intervention, the error rates per order per patient after the intervention did not differ across sites. Therefore, there are limited explanations for the observed reduction in error rates other than an effect of the medication chart itself.
Comparison with other studies and justification of higher error rates
The error rate identified in our study was considerably higher than the 1.5%–6.7% found in three recent prospective UK studies,22 38 41 even though the same definitions of prescribing errors were used. In a previous study, using similar methodology, we identified an error rate of 2.5% of orders per patient with an error.33 Variation in prescribing error rates is known to be observer dependant.12 This earlier study was undertaken with a pharmacologist and pharmacist observer; part of this difference in rates between our two studies may be attributable to the use of a nurse in our audits.
The observers in the three UK studies mentioned above and many similar studies used pharmacists alone.12 The majority of errors identified in this study (92%) were administration or supply instruction errors associated with ambiguous, incomplete or illegible medication orders. Pharmacists readily interpret prescribing, possibly without a full understanding of potential errors in interpretation by nursing staff. However, in Australian hospitals, pharmacists only review medication orders Monday to Friday during between 08:00 and 18:00, and in some hospitals, no pharmacist review occurs. Furthermore, evidence of the high frequency of nursing administration errors34 and nurses’ inability to detect prescribing errors36 lead us to use nursing staff in combination with pharmacists to interpret administration and supply instructions in this study.
Comparison with electronic prescribing
The medication chart was not expected to decrease prescribing errors in the same way as electronic prescribing with CDS. Paper-based prescribing cannot include “hard” barriers that prevent contraindicated drugs from being ordered or force prescribers to prescribe legibly and enter every component of an order. However, our study shows that changing the chart layout, including prompts for structured dose and frequency instructions and providing decision support such as ADR history and warfarin prescribing information reduce errors.
Development of medication chart
We believe the success of our intervention was related to the multidisciplinary, collaborative, evidence-based approach.42 The ability for all clinicians, including those who had made significant errors, to contribute to the intervention’s development, and the provision of feedback during the intervention processes were critical.
Impact on clinician training
The presence of a standard chart has enabled staff to be trained effectively and efficiently. All staff will be familiar with the medication system irrespective of where they work in Queensland, reducing the risk of errors due to unfamiliarity with different systems. A safe medication practice program for all undergraduate medical students at the University of Queensland has been introduced,28 along with a program for raising awareness of medication errors for all new nursing staff.36 Pharmacists entering the health workforce are introduced to the medication system during undergraduate training.
Limitations
This study was undertaken as a quality improvement initiative. There was no known change in prescribing education and training either as undergraduate or junior doctor during the “pre” and “post” phase of the study. However, the level of clinical pharmacy service provided at each site was not assessed during pre- and post-intervention phases, and this could have affected the standard of prescribing.
As there was no control arm, the differences observed can only be assumed to be due to the introduction of the new chart. Bias could have been introduced by using the same investigators in the audits who developed the chart, but this was countered by pairing investigators with local nurses or pharmacists at each site. We did not look at the degree of clinical significance of the errors because this was outside the scope and objectives of this work. We acknowledge the measures of INR >5 included a background “noise” of patients’ not receiving warfarin but believe that this was a constant confounder and changes seen were due to the chart and CDS.
Conclusions
Implementation of a standard medication chart has addressed many factors associated with prescribing errors. The task of prescribing has been improved through the changed chart layout. Defences in the form of alerts, checks and information have been introduced to increase error detection. Uniform medication training is now possible, which may further reduce errors by way of improved prescribing skills and familiarity with systems. Further error reduction would be possible with the introduction of electronic prescribing with CDS, as long as the processes of development and introduction follow the human factor principles applied in this study. Similarly, the development of specialist charts for fluids, analgesia or insulin would also benefit from a similar methodology.
As a result of this study, organisational wide standardisation of systems and training has been facilitated. The chart was endorsed as the statewide chart and has been implemented in all 108 public hospitals in Queensland. The chart was adapted and piloted by a national collaborative process before becoming the Australian National Inpatient Medication Chart.
Acknowledgments
The authors would like to acknowledge all medical, nursing and pharmacy members of the Brisbane South Adverse Drug Event Collaborative who assisted with the development of the standard medication chart. The authors also wish to acknowledge the kind assistance of Dr Carl Kirkpatrick of School of Pharmacy, University of Queensland for advice on data analysis.
Appendix
Appendix 1: Standard medication chart as implemented across Queensland Health Public hospitals, after review of findings in the before-and-after study.


REFERENCES
Footnotes
Funding This was a component of Queensland Health Safe Medication Practice Program.
Competing interests None.
Linked Articles
- Quality lines